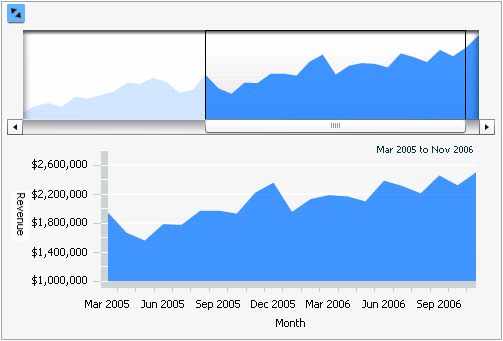
A Time Series Slider widget is an area graph. The top graph is the controller, where you move the slider to choose which section of the graph to view. The bottom graph is the primary graph, and it is updated automatically when you use the slider in the controller.
Time series data can be long and require analysis from both a high-level and a detailed view. The Time Series Slider widget displays values for only one attribute, which is usually time-based, to limit the amount of data viewed at one time. The attribute may not always be time-based.
In the Time Series Slider graph:
The X-axis represents the attribute. In the example below, this is the Month attribute.
The Y-axis represents the metric. In the example below, this is the Revenue metric.

To analyze data in a Time Series Slider widget:
To determine which part of the graph to view, use the scroll bar at the top of the widget to adjust the slider's position.
To determine the range of graph values to view, drag the left or right edge of the slider at the top of the widget to adjust its size.
To hide (or show) the graph controller, select the Expand/Collapse button at the top left of the widget.
If the document contains a Grid/Graph report or panel stack that is connected to this widget, use the Time Series Slider controller and primary graph to display related data in connected grid/graph reports and panel stacks.
Some features described above may not be enabled in all documents.
Related topics