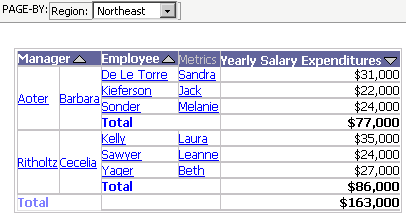
When you have a very large set of data on a report, it can be easier to work with that data by grouping it into logical subsets, and viewing only one of the subsets at a time. To group data into subsets, you can use the page-by feature. The subsets you separate your business data into are called pages, and you then page your way through the report, one data subset at a time.
For example, the report below shows salary expenditures by Region, Manager, and Employee. You can place Region on the Page-by area and view the salary expenditures data by Manager and Employee, one region at a time. All the data from the report is still present, but it is grouped into smaller, more manageable sections.

Attributes and metrics are the most common objects used in the page-by area of a report, although you can enable page-by for most objects that appear on a report. You can page-by any of the following objects:
Attributes
Metrics
Hierarchies
Consolidations and custom groups. For a detailed explanation of consolidations and custom groups, see the MicroStrategy Advanced Reporting Guide.
Most Object prompts. Specifically, object prompts that are made up of attributes, hierarchies, consolidations, and custom groups. Object prompts containing metrics can be placed in the page-by area as long as the report’s rows or columns do not contain a metric. For a detailed explanation or prompts, see the MicroStrategy Basic Reporting Guide.
You can drill on an attribute or compound metric within the Page-by axis. For more information, see Drilling on a grid report.
This procedure assumes that Page-by is enabled. Page-by can be enabled or disabled for your project by your project designer.
You can place more than one object in the page-by area. If you decide to place multiple related attributes in the page-by area, be aware that order matters. Whatever you page-by first (furthest to the left) affects the elements displayed in the other page-by fields. Place multiple objects into the page-by area in logical order, from left to right.
Click the name of a report to execute it.
To show the Page-by area, from the Tools menu, select Page-by Axis.
If DHTML
is disabled, click the Go icon
![]() .
.
Right-click the object's header in the report, select Move, and then select To Page-by Axis.
To move metrics to the page-by area, right-click the word Metric on the report and select Page-by. All metrics must be moved together. You cannot have one metric in the page-by area and one on the report grid.
The report is automatically re-displayed to show only the subset of data reflecting the current page-by field. Select an option from the page-by field's drop-down list to change the subset of data displayed.
You can reposition the objects in the Page-by area. Right-click the object on the Page-by area, select Move, and then select To Columns or To Rows, as necessary.
Related topic